Uncover the electricity usage of your different circuits and keep track of your energy consumption as you go.
Switch your data on to bring down your electricity usage
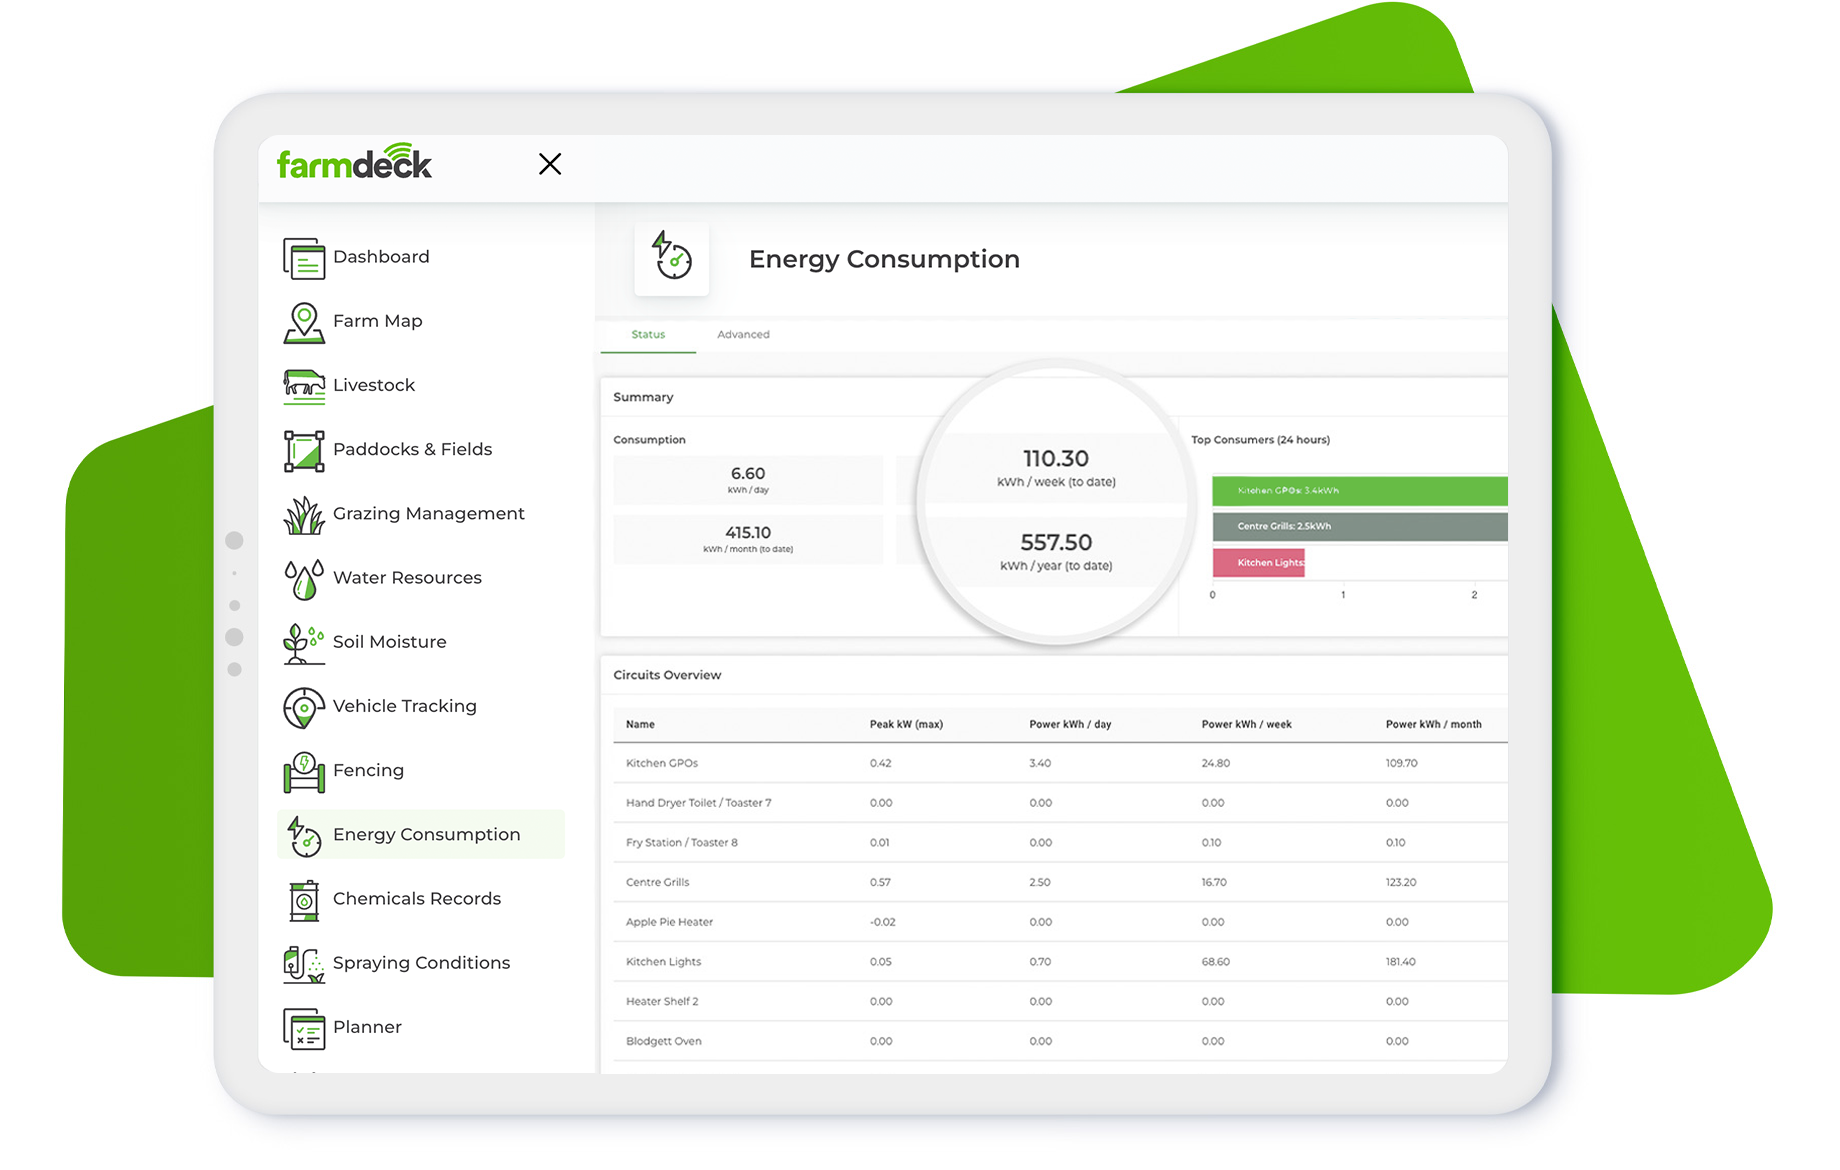
Using this Farmdeck feature allows you to track your electricity consumption as you go and can help avoid bad surprises when receiving your energy bill at the end of the quarter. Look at your energy usage trends per circuit, during various times of the day, and see how you can reduce your electricity consumption.
Interested in other monitoring capabilities? Take a look at our ef=”https://www.farmdeck.com/feature/water-level-monitoring/”>water level monitoring feature which provides you with a reliable snapshot of all the water sources on your land so you know your water levels, individual tank capacities, and sensor status data at all times…
Watt your data can tell you about your energy consumption
The Farmdeck Energy Consumption dashboard provides a summary consolidating your overall electricity consumption per day, per week (to date), per month (to date), and per year (to date). This data is also available for all individual circuits. Use the historical data to keep track of your farm’s energy cost and power usage trends.
Interested in going a bit further? Our Advanced tab shows max voltage for phase 1,2,3, an historical view of the distribution board, and the consumption history. The later is based on 17 different energy measurements:including Active Energy, Apparent Energy, Active Energy Max, Current, Reactive Energy Import and Export.
Energy Consumption insights can be used to:
-
-
- Discover what your standby, after-hours, and/or overnight energy usage is.
- Find out if bills from your energy company are inflated.
<li>
-
Know what behaviour change is required to substantially reduce energy consumption.
Bring Farmdeck to mobile and tablet, too.
Managing your farm on your phone has never been easier!